
Calculating ROI: The True Cost of Running a Commercial E-Cargo Bike Fleet


Calculating the true return on investment for a commercial e-cargo bike fleet requires looking well beyond the initial purchase price. In 2026, businesses transitioning to electric last-mile delivery must account for total cost of ownership (TCO), including maintenance, battery logistics, downtime, and utilization patterns that can dramatically affect payback periods. When done right in dense urban routes with strong operational support, e-cargo bikes can deliver meaningful cost advantages over vans, but hidden operational frictions often erode those gains if fleets underestimate real-world uptime and service needs.

Understanding Total Cost of Ownership for Commercial Cargo Bike Fleets
Fleet ROI should be calculated on total cost of ownership, not purchase price alone. This EV fleet TCO perspective highlights that meaningful analysis must include purchase or lease costs, financing, maintenance and repairs, insurance, energy consumption, battery considerations, spare parts, service labor, and the often-overlooked cost of downtime when vehicles are unavailable.
For commercial cargo e-bike for delivery operations, these categories shift compared to traditional vans. Upfront costs are typically lower for e-cargo bikes, but battery management and service access become more prominent. Commercial fleets should evaluate warranty coverage, parts access, and service turnaround as part of ROI, especially since unresolved details around long-term support can create unexpected expenses.

A practical TCO model for a small fleet might track these elements over a three-year horizon. For example, a five-unit e-cargo bike fleet could show lower net costs in purchase, energy, and certain downtime scenarios compared to vans in optimized routes, but this depends heavily on keeping utilization high. The chart below illustrates a modeled breakdown of these relative cost structures.
Illustrative 3-Year TCO Breakdown and Payback Sensitivity for a 5-Unit E-Cargo Bike Fleet
Illustrative modeled TCO structure; not a forecast or official dataset.
View chart data
| Category | E-cargo bikes | Vans |
|---|---|---|
| Purchase / Financing | 45000.0 | 80000.0 |
| Maintenance | 15000.0 | 21000.0 |
| Insurance | 7000.0 | 12000.0 |
| Energy | 2500.0 | 9000.0 |
| Battery Reserve | 8000.0 | 0.0 |
| Downtime Cost | 5000.0 | 14000.0 |
| Net 3-Year TCO | 82500.0 | 136000.0 |
Modeled illustrative comparison only. Cost buckets are organized from user-provided evidence themes: purchase/financing, maintenance, insurance, energy, battery reserve, and downtime cost. Values are heuristic, normalized for a 5-unit fleet over a 3-year horizon, and should be read as relative magnitudes rather than measured statistics.
This illustrative comparison shows how e-cargo bikes can reduce certain categories like energy and purchase costs, but battery reserves and potential downtime must be factored realistically. These numbers are heuristic and intended only to clarify relative cost structure, not as measured benchmarks.
How Maintenance, Repairs, and Parts Availability Affect ROI
Maintenance and repairs represent a significant variable in e-cargo bike uptime and maintenance calculations. Unlike vans, which often have established service networks, commercial cargo bikes depend on specialized parts and technicians familiar with electric systems. Delays in parts availability can quickly translate into lost deliveries and higher effective costs.
Commercial fleets should prioritize models with strong warranty coverage and accessible service. The 2026 e-bike serviceability and right-to-repair standards provide practical checklists for fleet operators evaluating modularity and compliance, which directly impact long-term ownership costs.
Hidden tradeoffs emerge here. While e-cargo bikes generally require less routine maintenance than combustion engines, battery and motor repairs can be more expensive when they occur. Poor parts availability or long service turnaround times amplify downtime costs, potentially erasing expected savings. Fleet managers must build in buffers for these realities rather than assuming minimal intervention.
The Role of Swappable Battery Systems in Uptime and Efficiency
Swappable battery systems can significantly improve e-cargo bike uptime and maintenance by reducing charging downtime. Instead of waiting for a full recharge, operators can swap in a charged battery and keep the bike on the road. However, this benefit comes with its own logistics: maintaining a spare battery inventory, managing charging stations, and handling battery security and tracking.
Battery and load-handling logistics can be improved when e-cargo bikes are integrated into satellite-delivery workflows. Research shows that optimized systems with handoff points and containerized loads enhance overall efficiency. Cargo bike with swappable battery options are particularly valuable for high-utilization courier operations where every hour of downtime affects revenue.
Yet the tradeoff is real. Swappable setups add complexity and capital cost for extra batteries. In low-density or irregular routes, the added operational discipline may not pay off. Businesses must assess whether their dispatch system can support quick swaps without creating new bottlenecks.
Comparing Cargo E-Bikes for Delivery Against Vans and Other Vehicles
Research centers have compared cargo e-bikes with delivery vans and trucks in last-mile use cases. Academic research supports using e-cargo bikes within optimized last-mile systems rather than as standalone vehicles. The choice often depends on route characteristics rather than a blanket superiority.
Fleet operators compare e-cargo bikes and cargo vans using downtime, payload, and deployment constraints. In dense urban environments with many short stops, e-cargo bikes often excel due to easier parking, lower congestion impact, and reduced energy costs. Vans may retain advantages for heavier or bulkier payloads that require fewer trips or when routes span longer distances where speed matters more.
Some cargo-bike manufacturers argue e-cargo bikes can have a materially lower TCO than vans in dense urban delivery use cases, but this holds primarily under high utilization and structured workflows. The scenario matrix below outlines when the economics typically favor one over the other:
- Dense urban, high stop density, moderate payload, strong utilization: E-cargo bikes generally provide better cost per delivery through lower operating expenses and flexibility.
- Heavy or variable payloads, longer routes, unpredictable schedules: Vans or scooters often prove more practical as they reduce the need for multiple trips or extra labor.
- Low utilization or poor maintenance access: Any vehicle type suffers, but e-cargo bikes can see ROI erode faster if downtime cannot be recovered.
Commercial e-cargo bike ROI depends on utilization and real-world fleet integration, so uptime tracking matters. Operators should measure completed stops or shifts rather than simple mileage to make accurate comparisons.
What Warranty Coverage and Serviceability Matter Most
For commercial fleet cargo bike purchases, warranty terms extend beyond basic coverage. Key elements include battery warranty duration, motor and electronics protection, and provisions for commercial use rather than consumer riding. Parts availability and authorized service networks directly influence downtime and therefore ROI.
Fleet operators should review service level agreements and right-to-repair options. Modularity in design—such as easily replaceable components—reduces repair times and costs. In 2026, evolving standards around e-bike serviceability emphasize these factors for business users.
Do not buy on ROI assumptions alone if the fleet cannot measure utilization, manage maintenance quickly, or absorb downtime. In many real operations, the first failure mode is not energy cost; it is the time cost of bikes sitting unused, waiting for charging, parts, or a service fix.
How Fleet Utilization, Route Density, and Payload Influence Payback Period
Payback period calculations hinge on daily utilization rates. A cargo e-bike that completes 80-100 stops per day in a dense area may achieve payback within 18-24 months, while one averaging fewer than 40 stops could take much longer or never fully offset costs.
Route density plays a central role. High-stop urban corridors favor e-cargo bikes because they minimize travel time between deliveries and maximize the advantage of quick parking and maneuvering. Payload requirements must align with bike capacity—regularly exceeding practical limits forces extra trips that diminish efficiency.
Businesses should model scenarios using their own data. Track metrics like average daily mileage, stops per shift, payload per trip, and downtime hours. These inputs allow more accurate forecasting than generic industry averages.
Decision Framework: When Commercial E-Cargo Bikes Make Sense
The biggest information gain opportunity is to make uptime and battery logistics the center of the model, not an afterthought. For commercial fleets, a bike that is cheap to own but frequently unavailable can end up more expensive than a van on a per-completed-delivery basis.
Strong fit scenarios include repeatable local routes with satellite or hub support, predictable charging access, and the ability to maintain high utilization. Weak fit occurs with irregular schedules, high payload variability, or limited service infrastructure.
Important Note on Comfort and Health Considerations
This article discusses operational costs, uptime, and fleet economics. It does not address medical or health claims. E-cargo bikes involve physical activity that may affect rider comfort depending on route, load, and individual fitness. This discussion only covers setup and business advice; it does not constitute medical advice, diagnosis, or treatment. If riders experience persistent discomfort or have existing conditions, consult qualified professionals.
Small business owners and fleet managers should start with an operational audit: map current routes, measure utilization potential, assess service access, and calculate a full TCO using their specific numbers. Only then can the ROI picture become clear enough for confident decision-making.
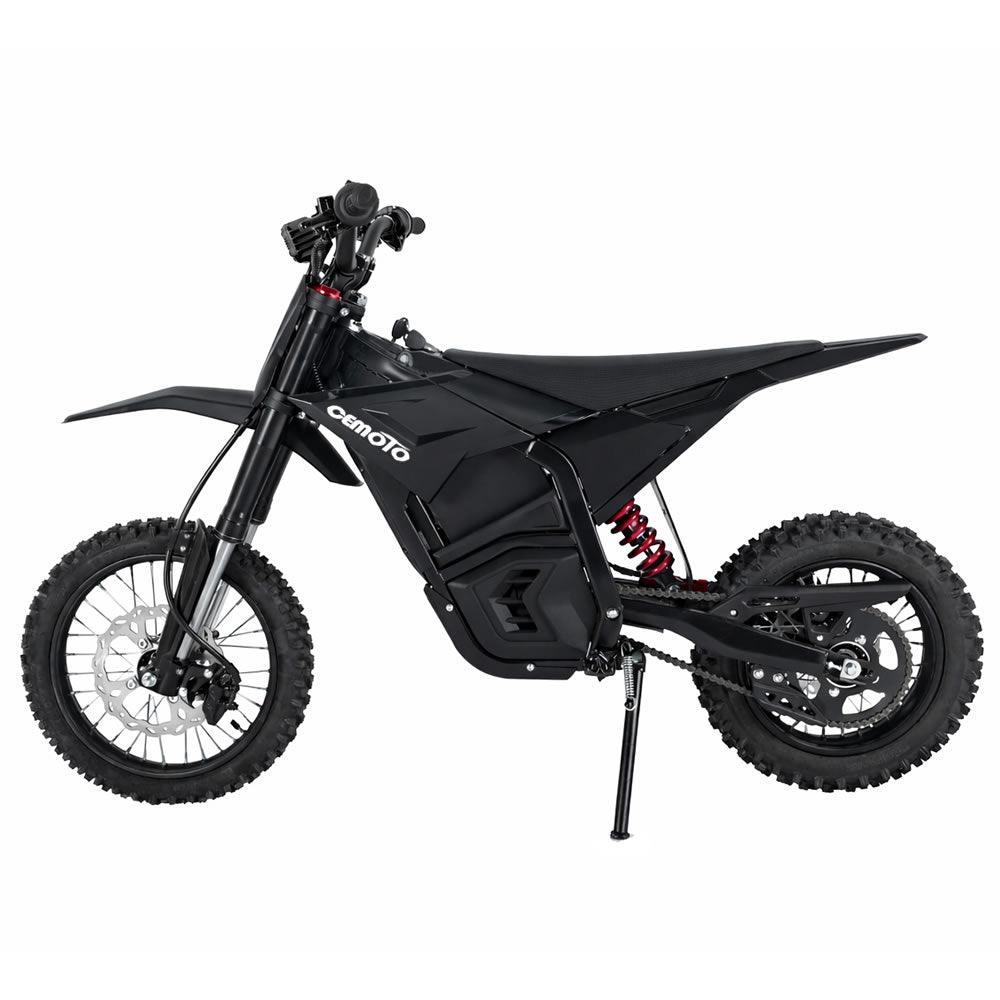
For those exploring heavy-duty options suited to commercial use, the Cargo Electric Bike |CEMOTO B69 750W Heavy Duty E-Bike 150kg Capacity offers features aligned with delivery needs, including substantial payload capacity. Pairing such models with proper workflow design maximizes the chance of positive returns.
Additional reading on cargo bike fundamentals can provide context for fleet integration. Check the Everything You Need to Know About Cargo Electric Bikes for practical use cases and the Ultimate Guide to Cargo Electric Bikes in 2025 for feature breakdowns that remain relevant.
References
- An EV Fleet Perspective of the Total Cost of Ownership (TCO)
- A long-term trial framework for cargo bike and light electric vehicle integration in commercial fleets
- Designing zero-emissions containerized last-mile delivery systems with e-cargo bikes
- 2026 E-Bike Serviceability & Right-to-Repair Standards
