
Evaluating Total Cost of Ownership for Electric Cargo Bike Fleets


Evaluating Total Cost of Ownership for Electric Cargo Bike Fleets
For delivery businesses and fleet operators in 2026, the total cost of ownership (TCO) for an electric cargo bike fleet often determines long-term profitability more than the sticker price alone. By factoring in energy costs, maintenance intervals, battery management logistics, downtime, and real-world durability alongside the initial purchase, businesses can identify models that deliver strong ROI on urban last-mile routes while avoiding hidden expenses that erode margins.

What Total Cost of Ownership Means for Electric Cargo Bike Fleets
A comprehensive TCO model should include the purchase price, energy/charging costs, routine maintenance, unplanned downtime, and eventual battery replacement. This broader view reveals how higher-quality heavy-duty cargo bikes can offset their upfront cost through lower operating expenses and higher uptime over a typical 3- to 5-year fleet lifecycle.
To build a reliable TCO model, we recommend tracking these five primary variables:
- Acquisition Cost: Unit price plus any specialized cargo boxes or branding.
- Energy Consumption: Typically estimated between $0.05 to $0.15 per 100 km, assuming standard commercial utility rates.
- Maintenance & Wearables: Tires, brake pads, chains, and labor.
- Battery Lifecycle: The cost of a replacement pack divided by its expected cycle life (usually 500–800 full cycles).
- Downtime Impact: The lost revenue or "rental replacement" cost when a bike is off the road.
Fleet managers at delivery companies should project these annual costs across 50,000 to 100,000 km of combined fleet usage to compare options accurately. If a fleet uses microhubs or staging sites, facility setup and charging infrastructure costs must also be integrated into the equation.
Comparing Upfront Purchase Price vs. Long-Term Operating Costs
Commercial cargo e-bikes typically range from $2,500 to $6,000 per unit depending on motor power, battery capacity, and payload rating. While budget models may appear attractive, a common pattern in the industry is that lower-tier components often lead to higher failure rates, potentially increasing the TCO within the first 18 to 24 months of heavy use.
Energy costs for electric cargo bikes remain significantly lower than fuel and maintenance for combustion vans. However, these savings only materialize when fleets minimize downtime. High-payload models rated for 150 kg or more, like those built for repeated heavy loads, tend to justify their higher initial cost in multi-stop delivery operations where vans struggle with parking and traffic congestion.
Battery Replacement, Swap Logistics, and Charging Downtime
Battery degradation represents one of the largest variable costs in any electric fleet. Most lithium-ion packs in commercial use retain approximately 70-80% of their original capacity after 500-800 full cycles. In a daily delivery environment, this often translates to a 2-to-4-year lifespan, depending on the depth of discharge and local temperature management.
Battery swapping can reduce time off-road compared to waiting for a recharge, which is especially relevant in multi-shift operations. However, swapping introduces its own overhead:
- Inventory: Requirement for 1.5 to 2 batteries per bike.
- Storage: Organized, fire-rated storage racks and tracking systems.
- Training: Staff discipline to ensure batteries are rotated and charged correctly.
In fleets with irregular routes or limited depot discipline, overnight charging often proves simpler and less costly overall. Here is a visualization of how the choice between battery swapping and overnight charging typically shifts across common fleet scenarios:
Battery Swapping vs Overnight Charging by Fleet Scenario
Decision heuristic for cargo bike fleet operations: higher values indicate a better fit for the operation type.
View chart data
| Category | Battery Swapping Fit | Overnight Charging Fit |
|---|---|---|
| Low predictability / Low utilization | 2.0 | 5.0 |
| Low predictability / High utilization | 5.0 | 2.0 |
| High predictability / Low utilization | 3.0 | 5.0 |
| High predictability / High utilization | 5.0 | 2.0 |
Decision heuristic derived from fleet studies on swapping friction, route dependency, uptime needs, and operational complexity. Values are bounded illustrative fit scores (1-5), not measured outcomes.
Typical commercial cargo bikes with 48V 20Ah batteries deliver an estimated 40-70 km of assisted range per charge under load. This range is a heuristic; actual performance varies based on rider input, terrain, and cargo weight.

Maintenance Intervals, Spare Parts, and Serviceability
Maintenance costs for well-designed cargo e-bikes are often cited as being 40-60% lower than equivalent gas-powered vehicles, but this assumes components are modular and parts are readily available.
Commercial fleets benefit from a predictive maintenance schedule:
- Brake Inspections: Every 1,000 km.
- Chain/Drivetrain Lubrication: Every 500 km.
- Electrical System Checks: Every 6 months.
As this 2026 E-Bike Serviceability & Right-to-Repair Standards guide explains, evaluating modularity and parts availability before purchase helps fleet operators control long-term expenses. Poor serviceability can double annual repair costs through longer downtime and the need for specialized labor.
Real-World Durability, Payload, and Lifecycle Value
Frame quality and payload capability directly influence failure rates. Heavy-duty cargo bikes rated for 150 kg or more with reinforced frames experience fewer structural issues under repeated commercial loads compared to lighter commuter models pressed into service.
On appropriate urban routes, cargo bikes can reduce vehicle miles traveled and emissions compared to diesel trucks. However, selecting the wrong model for the payload or terrain can lead to premature wear on motors and drivetrains. Operators report the best results when vehicles are matched to specific route demands rather than chasing maximum specifications that go unused.
Estimating ROI for Electric Cargo Bike Fleets
ROI calculations should project reduced fuel costs, lower maintenance, decreased parking/congestion fees, and improved delivery speed. While every route differs, a common benchmark for high-utilization fleets replacing vans with cargo bikes is a payback period of 18 to 30 months, assuming daily utilization exceeds 60 km per vehicle.
To validate your projections, we recommend tracking these key metrics:
- Deliveries per Hour: Often higher for bikes in dense urban cores.
- Vehicle Uptime: Leading fleets often target >92% uptime.
- Cost per Delivery: The ultimate metric for TCO efficiency.
When modeling, add a sensitivity analysis for battery replacement at year three or four to test how different degradation scenarios impact your long-term margins.
How to Choose a Heavy-Duty Model for Multi-Shift Operations
Prioritize models with UL-certified electrical systems, hydraulic disc brakes, and robust cargo platforms. If you plan on scaling, check for standardized battery connectors and local parts availability.
Fleet Evaluation Checklist:
- Does the bike carry your average and peak payload with a safety margin?
- Are batteries removable without tools and compatible across the entire fleet?
- What is the expected service interval for high-wear items under your specific daily mileage?
- Does the supplier offer fleet pricing and rapid spare parts support?
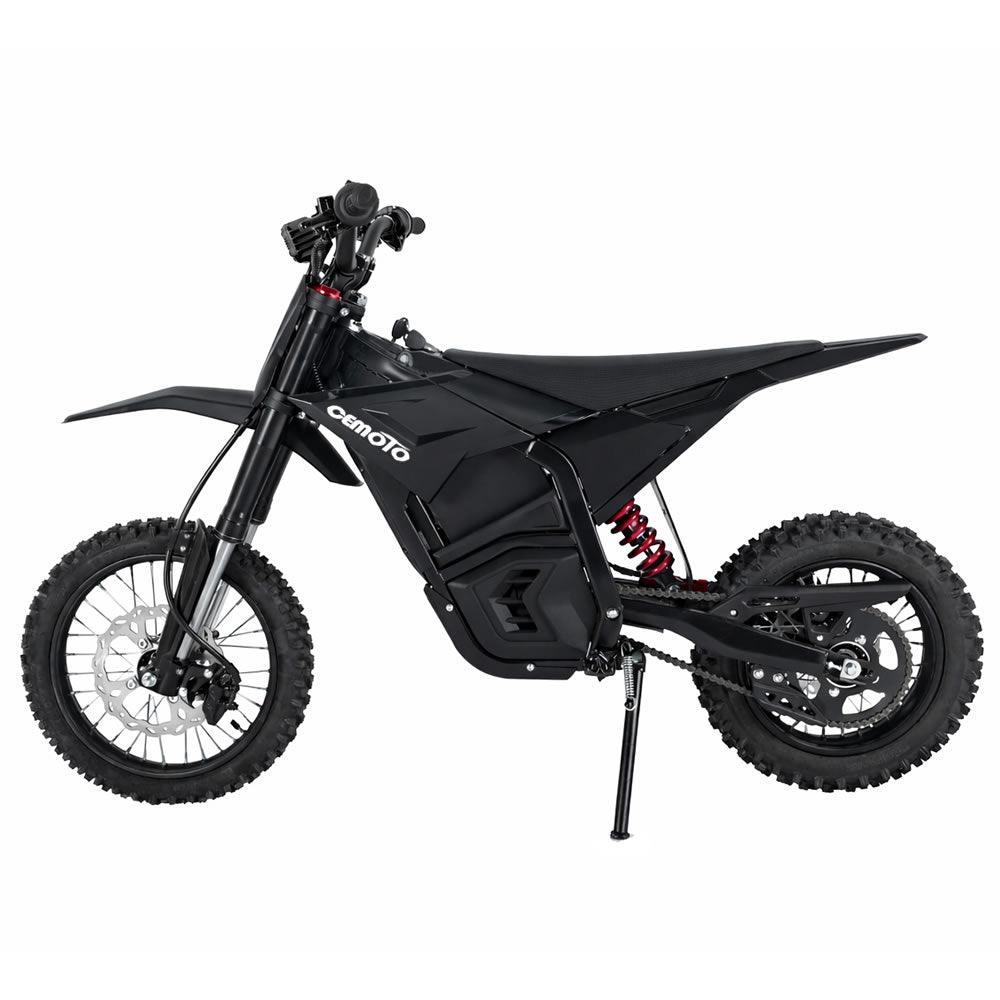
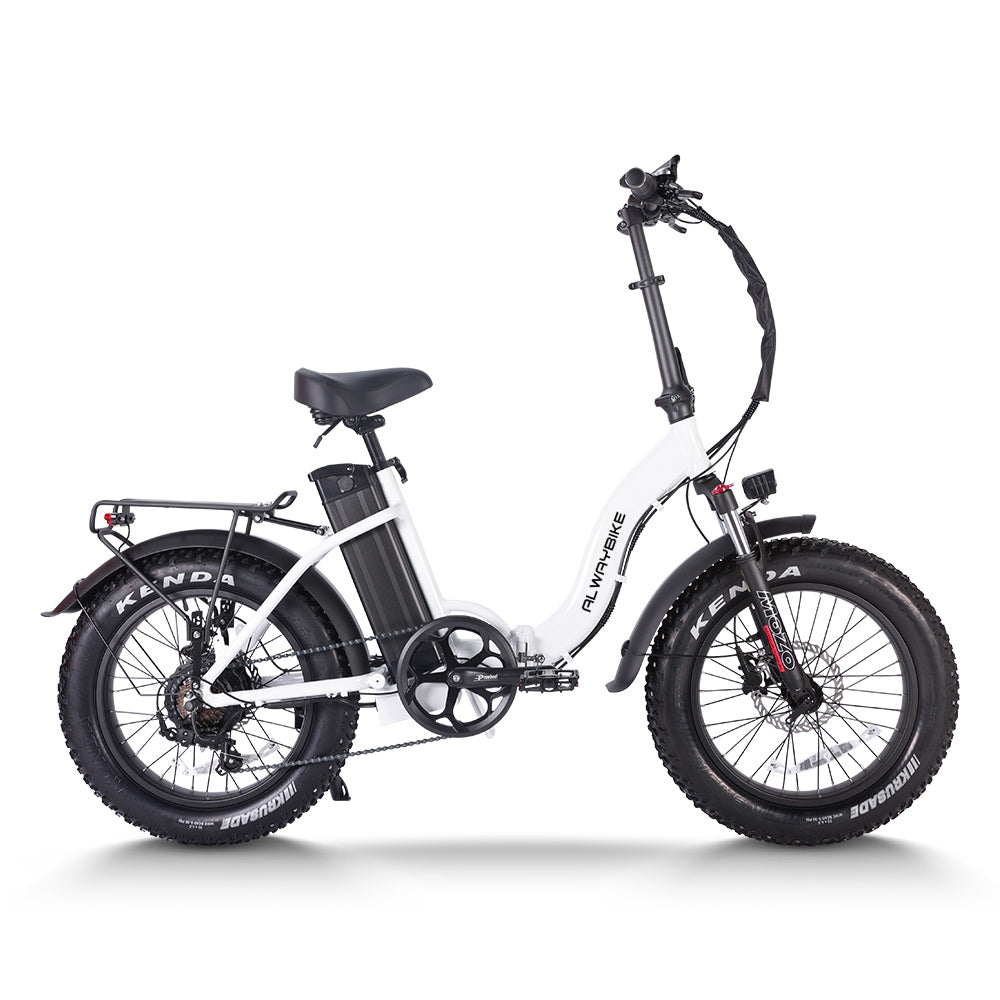
The Cargo Electric Bike |CEMOTO B69 750W Heavy Duty E-Bike 150kg Capacity offers a 750W motor and 150 kg payload designed for commercial use, making it a strong candidate for TCO modeling in last-mile delivery.
When Electric Cargo Bikes May Not Be the Right Choice
Electric cargo bike fleets may not suit operations with:
- Very Long Routes: Exceeding the practical range of two battery swaps.
- Extremely Heavy Loads: Consistently exceeding 200 kg.
- Harsh Winter Conditions: Extreme cold can accelerate battery wear and reduce range by 30% or more.
- Low Volume: Smaller or irregular delivery volumes may struggle to amortize the costs of depot-based charging or swapping systems.
Conclusion
Evaluating the total cost of ownership helps delivery businesses select commercial cargo e-bikes that balance upfront investment with predictable operating costs. By modeling battery logistics, maintenance, and route fit against your specific operation, you can make procurement decisions that support scalable, cost-effective last-mile delivery in 2026 and beyond.
Disclaimer: This article provides operational cost factors and general industry observations; it does not constitute financial, legal, or operational advice. Fleet performance depends heavily on local conditions, usage patterns, and maintenance practices. Consult qualified professionals for your specific business case.
